Pearson Edexcel · GCSE · Mathematics
Course version: 1MA1 · Version from Mar 2026
Statistics: apply statistics to describe a population
Describing a population means turning a data set into a few figures and then saying what those figures mean about the group.
Checked against the Pearson Edexcel 1MA1 specification (opens in a new tab) on .
- Point 6 of 7
- 4 key terms
Study notes
From the checked teaching notes for this specification point.
The idea
Describing a population means turning a data set into a few figures and then saying what those figures mean about the group. Choose an average that suits the data: the mode for categories such as favourite sport, the median where a few very large or very small values would distort things, and the mean where you want every value to count. Pair the average with a measure of spread, because two groups can share a mean and still look nothing alike. For wages of £18000, £19000, £20000, £21000 and £90000 the mean is £33600, yet four of the five people earn less than that, so the median of £20000 describes a typical wage better. Questions give you a table or a chart and ask what it shows about the group, or ask which average is the fairest to use and why.
What earns the marks
- Naming the average or measure of spread chosen, with a reason that refers to the data such as an extreme value.
- Working that statistic out correctly, even if the conclusion drawn from it is then wrong.
- A statement about the group of people or items, not only about the numbers.
- Supporting that statement with a figure quoted from the table or diagram.
Common mistakes and how to put them right
Quoting a mean and a range with no sentence saying what they show about the group.
Using the mean on data holding one very large value and then calling it the typical amount.
Describing the sample that was measured and calling the description true of the whole population.
Giving a modal category as its frequency instead of naming the category itself.
Exam tips
- Answer in a full sentence that names the group and the quantity, for example "most club members finished in under 30 minutes".
- If asked which average to use, say what the other averages would get wrong on this particular data.
- Keep the units on every figure you quote, and round money to the nearest penny.
Try the lesson
The start of the Statistics: apply statistics to describe a population lesson, made from checked teaching notes for this specification point.
Have a go first
A shop records the number of customers it serves each day for one week: 12, 15, 11, 14, 13, 15, 18. Work out the mean number of customers per day.
Listen
Describing a population means turning a data set into a few figures and then saying what those figures mean about the group. Choose an average that suits the data: the mode for categories such as favourite sport, the median where a few very large or very small values would distort things, and the mean where you want every value to count. Pair the average with a measure of spread, because two groups can share a mean and still look nothing alike. For wages of £18000, £19000, £20000, £21000 and £90000 the mean is £33600, yet four of the five people earn less than that, so the median of £20000 describes a typical wage better. Questions give you a table or a chart and ask what it shows about the group, or ask which average is the fairest to use and why. A strong answer earns marks for these points. naming the average or measure of spread chosen, with a reason that refers to the data such as an extreme value. working that statistic out correctly, even if the conclusion drawn from it is then wrong. a statement about the group of people or items, not only about the numbers. supporting that statement with a figure quoted from the table or diagram. Exam tip: Answer in a full sentence that names the group and the quantity, for example "most club members finished in under 30 minutes".
See it
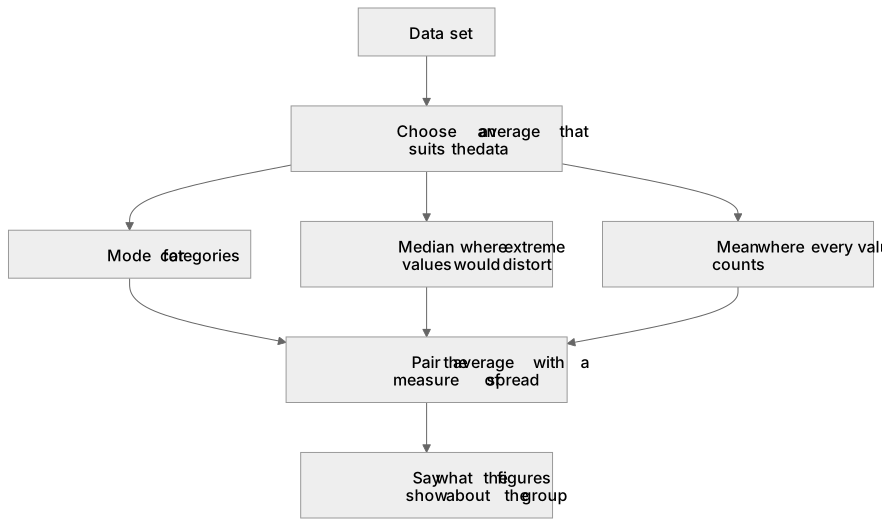
Key words
Say what each word means before you turn the card.
describing a population
Try answering aloud or in your head before turning the card.
choosing an average
Try answering aloud or in your head before turning the card.
average with spread
Try answering aloud or in your head before turning the card.
effect of extreme values
Try answering aloud or in your head before turning the card.
See every definition
- describing a population
- Turning a data set into a few figures and then saying what those figures mean about the group.
- choosing an average
- Picking the mode for categories, the median where very large or very small values would distort things, and the mean where every value should count.
- average with spread
- Pairing the average with a measure of spread, because two groups can share a mean and still look nothing alike.
- effect of extreme values
- A few very large or very small values can distort the mean, so the median may describe a typical value better.
Label the diagram
Some boxes have lost their names. Pick the right name for each number.
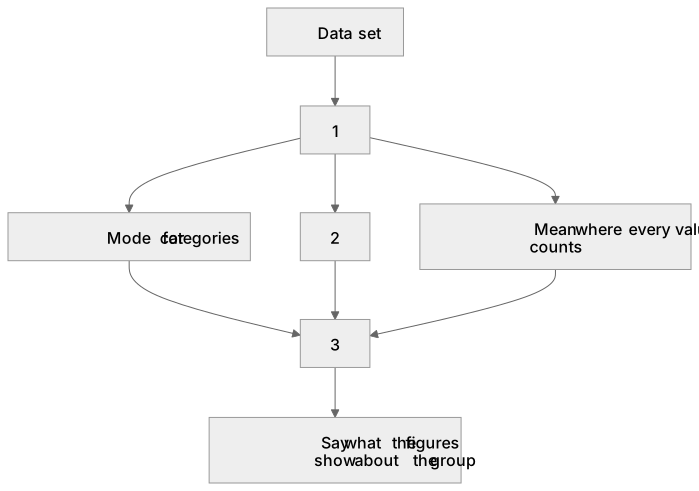
1Box 1
2Box 2
3Box 3
There is more to this lesson
The full lesson goes on to check your understanding and help you earn the marks. Create a free account to carry on, with your progress saved.
A week of Premium from your first lesson · Then the free plan continues · No card, no charge
Test your understanding of Statistics: apply statistics to describe a population
Active recall beats re-reading. Take an instant quiz now to test what you’ve learned and lock it into long-term memory.
A week of Premium from your first lesson · Then the free plan continues · No card, no charge